Data-driven narratives are essential in today’s video-first market. Discover the top four data visualization apps that will transform your video production, making complex information clear, engaging, and digestible.
In the age of social media, video content reigns supreme, captivating audiences across various platforms. As we navigate this video-first market, the integration of data-driven narratives has become important to video producers. By weaving data into our stories, we not only enrich the content but also support its credibility.
Visualized data plays a crucial role in this transformation, turning complex information into clear, engaging, and digestible visuals. For video producers, editors, and marketers adopting efficient data visualization tools is no longer an option—it’s a necessity. This article explores the top four data visualization tools that are set to reshape video production in 2025.
The Role of Data in Video Storytelling
Data is a powerhouse, driving narratives with precision and authority.
When video content is backed by data, it gains a layer of authenticity that resonates with audiences. Take, for example, video annual reports. By incorporating data visuals, video producers and marketers can effectively communicate their client’s yearly goals and accomplishments. Their stakeholders are not just told about their company’s trajectory; they see it, understand it, and are moved by it. This is the power of data-driven video content—it informs, persuades, and leaves a lasting impact.
Top 5 Data Visualization Tools for Video Producers
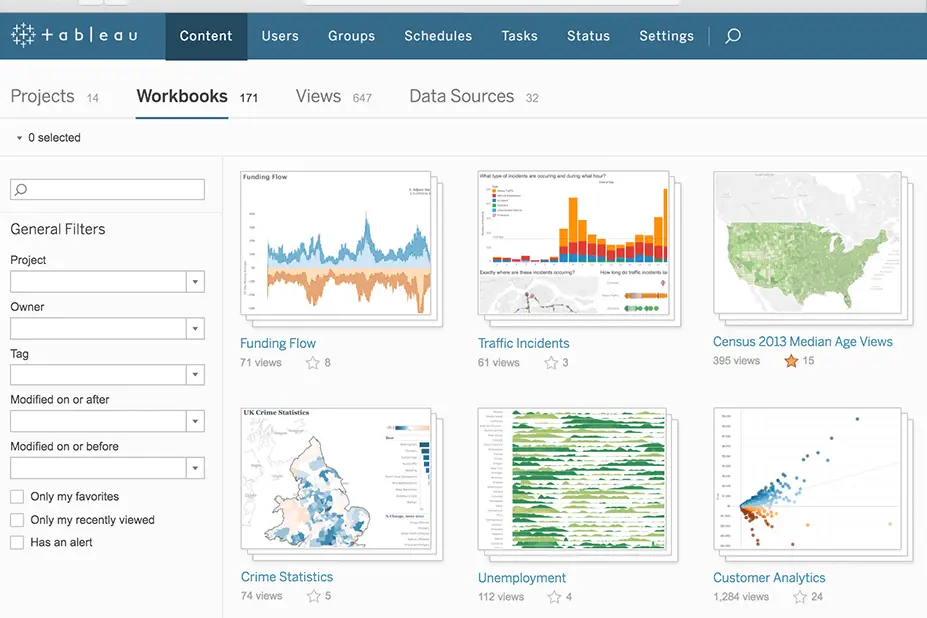
Tableau

Tableau stands out for its user-friendly interface and robust analytics capabilities. Video producers can seamlessly transform raw data into interactive, shareable dashboards.
Journalists at The Guardian used Tableau in the article “Revealed: royals took more than £1bn income from controversial estates” to create an interactive graph showcasing government spending, making dense budget data accessible to the public.
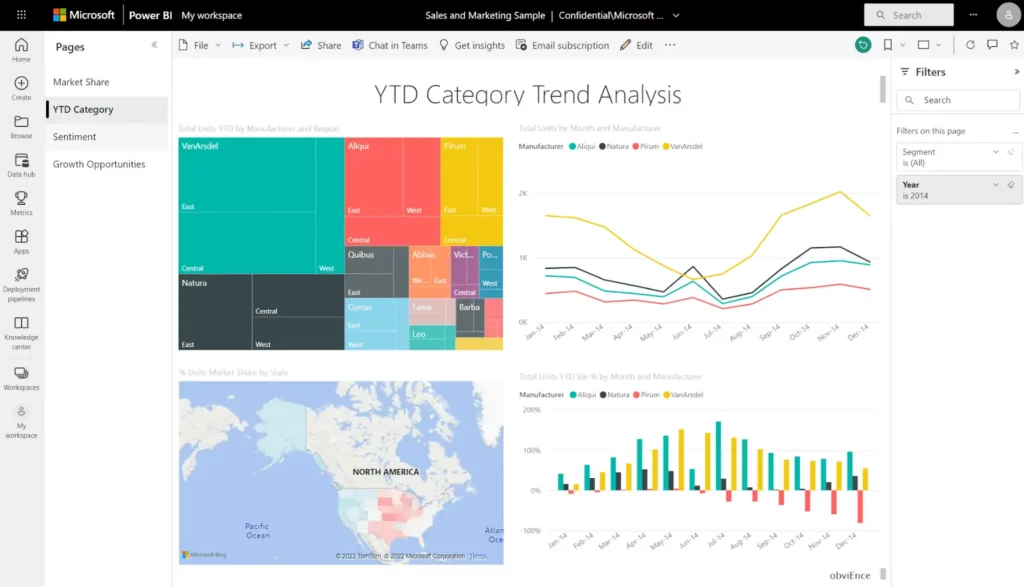
Power BI

Microsoft’s Power BI offers a comprehensive suite of analytics tools, perfect for creating rich visuals and reports.
Retail giants like Adidas use Power BI to visualize sales data, creating compelling narratives for their stakeholders.
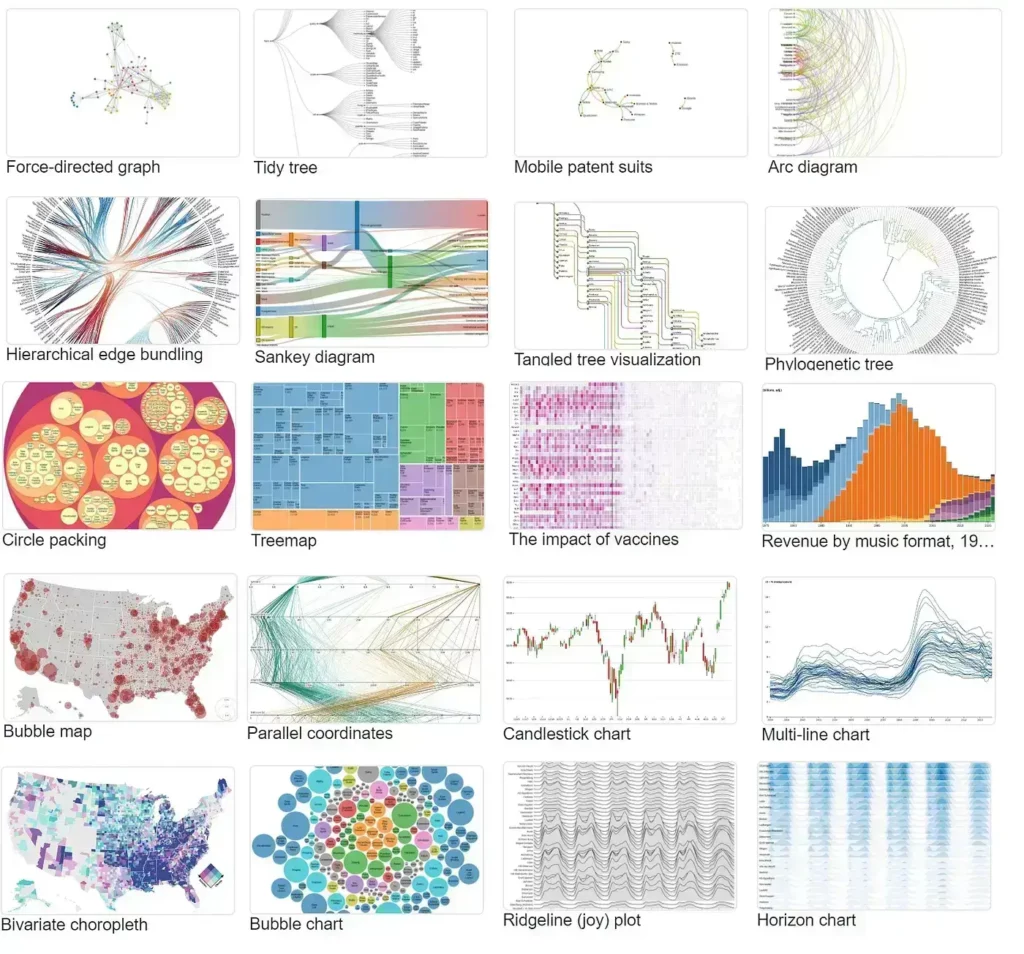
D3.js

For those comfortable with coding, D3.js offers unparalleled flexibility, allowing for the creation of dynamic, interactive data visualizations.
The New York Times frequently employs D3.js to craft intricate visual stories, making complex topics accessible. For instance, in the article “Extensive Data Reveals Impact of Racism on Black Boys,” the data is presented in a visually appealing way that breaks away from the conventional tables and charts.
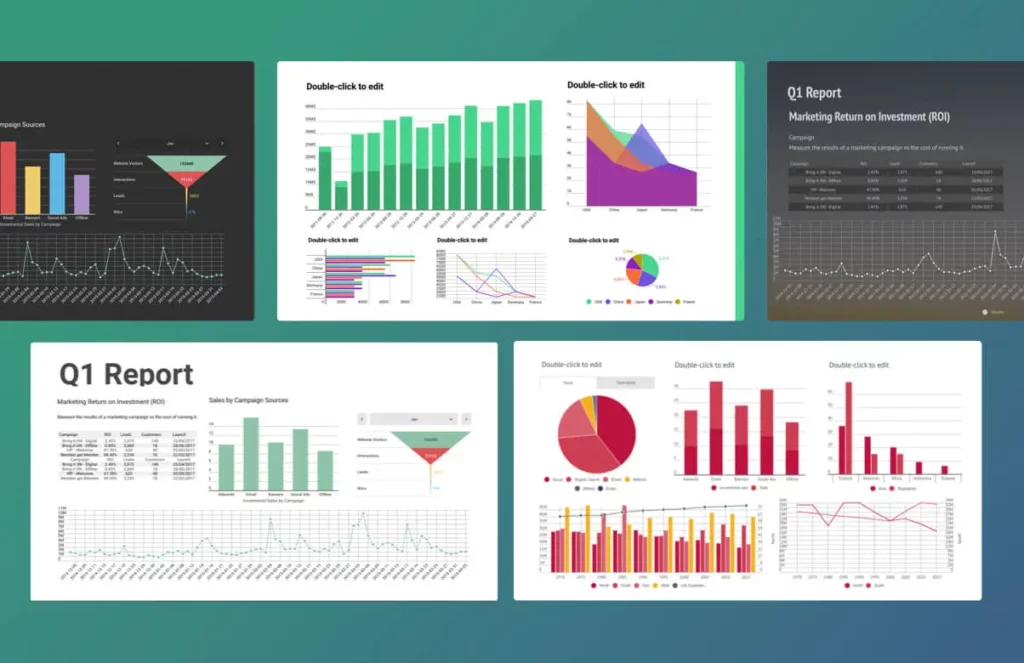
Infogram

Infogram is perfect for beginners, offering a wide array of templates and easy-to-use design tools.
Businesses and organizations use Infogram to create engaging infographics for social media, boosting their online presence. Take a look at this Earth Hour infographic using one of Infogram’s templates.
What’s Next?
When integrating data visuals into video content, clarity is key.
Choose the tool that best suits your data type and storytelling style. Avoid overcrowding visuals with information; simplicity often speaks louder than complexity. And remember, the goal is to enhance the narrative, not outshine it.
As we embrace the video-first era, the integration of data visualization in storytelling is not just beneficial—it’s essential. The tools listed above are stepping stones towards creating content that is not only visually appealing but also rich in substance. Video producers and editors, the time to harness the power of data visualization is now. Elevate your storytelling, connect with your audience, and let your data-driven narratives shine.
ALSO READ: Why Data Visualization is a Powerful Storytelling Tool
M2.0 Communications is a video production agency in the Philippines that offers brand videos, explainer videos, and animation videos to effectively tell your brand’s story. Visit our case studies to learn more about the brands we collaborate with.


